Overview
A predictive-maintenance system that flags likely failures of a critical engine component (“Component X”) across a fleet of heavy-duty trucks. Each truck trip is scored, where a higher anomaly score means the component is more likely to fail in the near future. The project was built under a deliberate constraint of using no deep learning, relying only on classical data-mining methods to keep the solution interpretable and effective on scarce, imbalanced data.
Problem & Constraints
The work uses the SCANIA Component X dataset from the IDA 2024 Industrial Challenge. The setup is semi-supervised: the training set holds 318 trips that are all normal, so the model must learn the normal operational profile and flag deviations from it. The validation (67) and test (167) sets mix normal and failing trips. Each trip is a multivariate sensor time series with irregular sampling and missing readings, joined to a static table of truck specifications. A key project constraint was strictly avoiding deep learning to maintain model interpretability and low computational footprint.
My Contribution
- Temporal Signal Engineering: Designed linear interpolation, trip-scoped missing indicator forward/back-fill, and rolling-window statistical features (derivatives, entropy, higher-order moments) that yielded a ~70% AP jump on the Isolation Forest baseline (0.3126 → 0.5324).
- Ensemble Architecture: Benchmarked and composed a score-averaging ensemble across 7 complementary outlier detectors (Isolation Forest, HBOS, KNN, LOF, ABOD, OCSVM, INNE), finding an optimal 6-model combination reaching 0.5879 AP and 0.7642 AUC-ROC.
- Trip-Level Window Aggregation: Developed window-level scoring and max-aggregation logic to convert dynamic multivariate time series into robust trip failure signals.
- Dimensionality Reduction & Diagnostics: Conducted PCA and t-SNE visual diagnostics to audit feature separability and guard against overfitting.
Data & Input Pipeline
- Time series regularization: linear interpolation onto a regular interval, since trips had irregular sampling rates and varying lengths.
- Missing value handling: a binary missing-value indicator per feature, then a forward-fill followed by a back-fill, applied independently per trip so values never leak across trips.
- Data integration: the processed sensor series joined to the static truck-specification table on
trip_id.
Method & System Architecture
The work progressed through three stages, all built on tree-based and distance/density-based detectors evaluated with Average Precision (AP) as the primary metric and AUC-ROC as a secondary one.
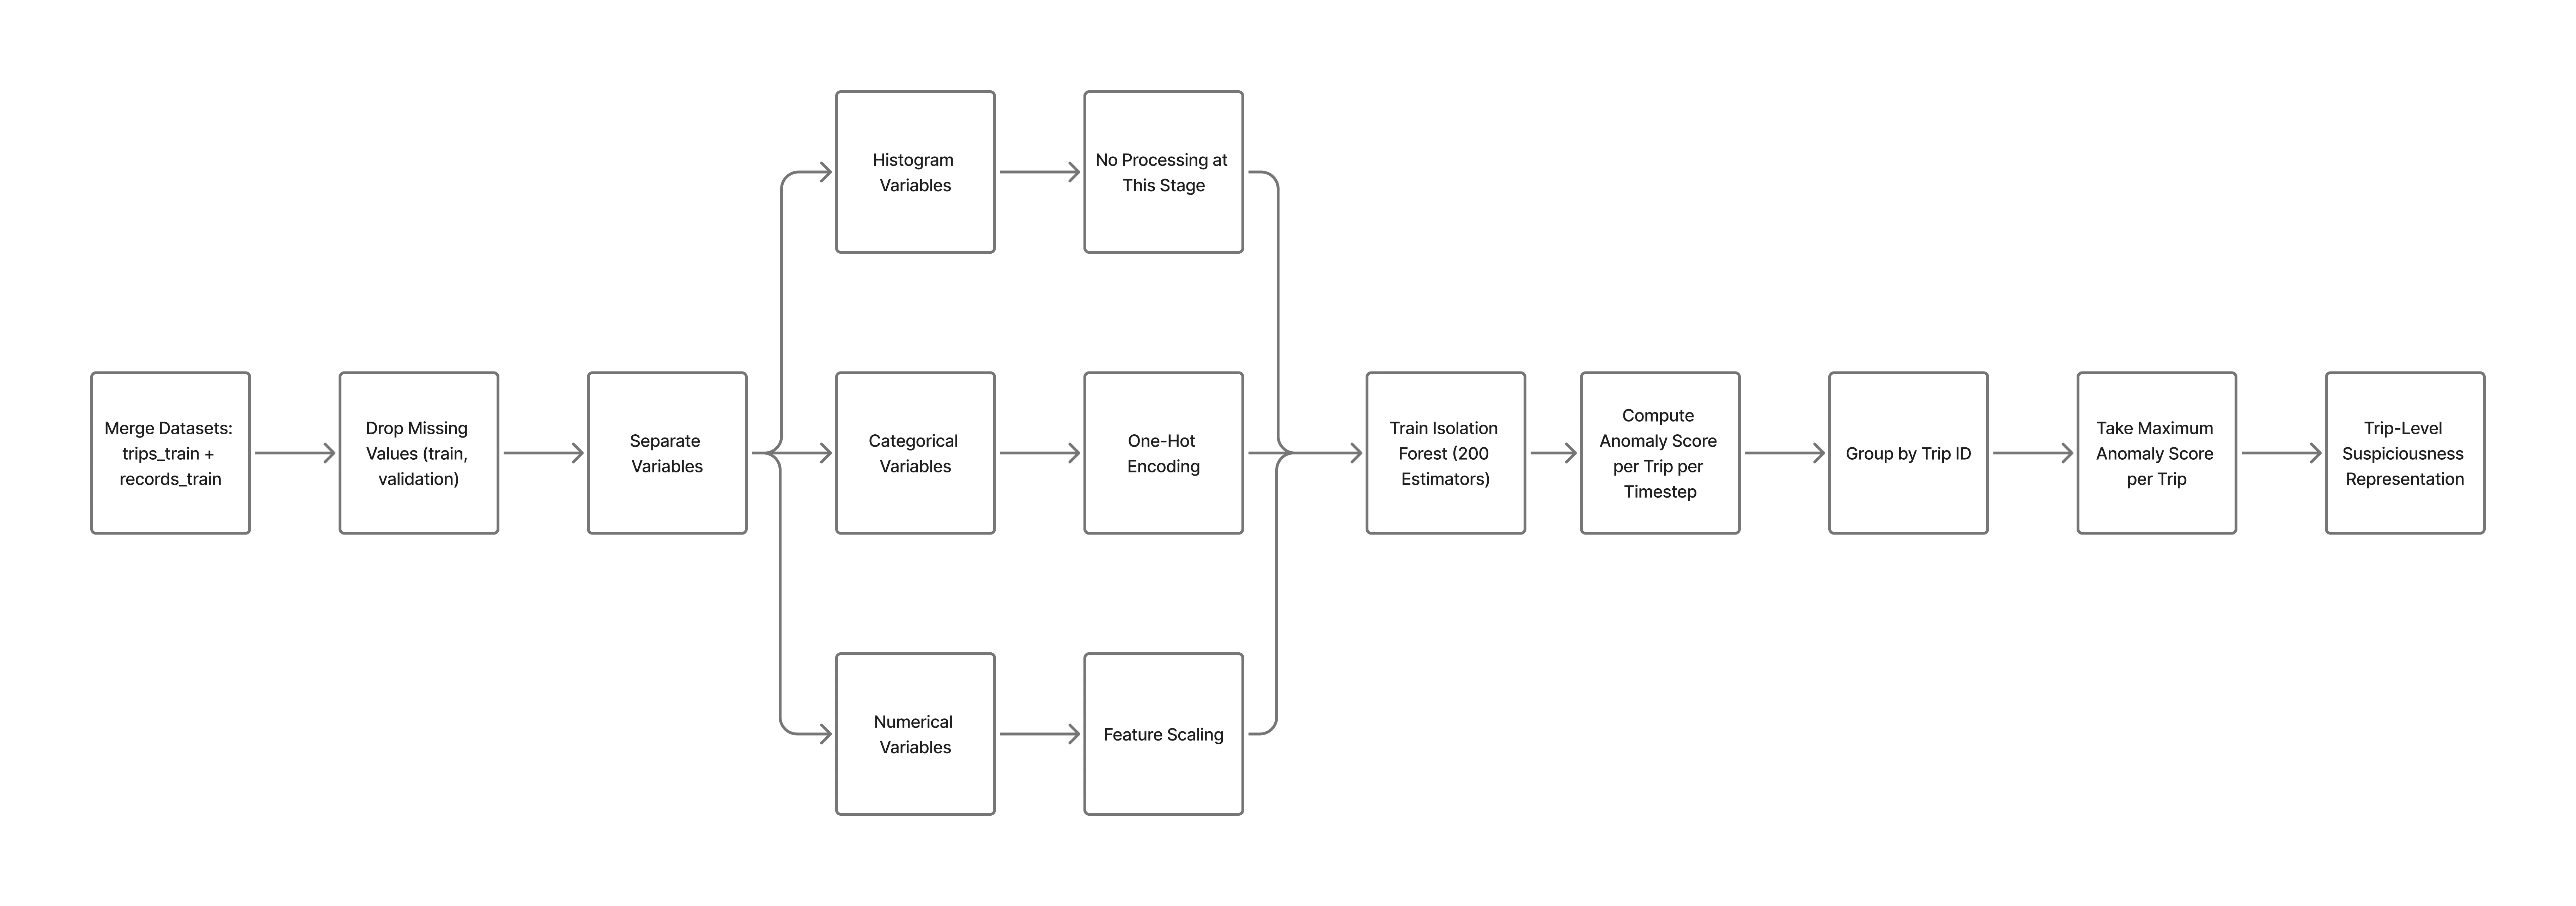
The Isolation Forest baseline pipeline: merge and clean the data, process each variable type, score every trip timestep, then take the maximum anomaly score per trip as its trip-level signal.
- Isolation Forest baseline: minimal features scored a validation AP of 0.3126. Adding temporal features from the interpolated series (percentage change between steps, plus min/max/mean/std summaries and sequence metadata) lifted validation AP to 0.5324, about a 70% gain, confirming that temporal dynamics carry far more signal than raw counter values.
- Score-averaging ensemble: anomaly scores were averaged across complementary detectors (Isolation Forest, HBOS, KNN, LOF, ABOD, OCSVM, INNE), chosen because precision-oriented and ranking-oriented models offset each other’s weaknesses. The best six-model ensemble reached a validation AP of 0.5879 and AUC-ROC of 0.7642.
- Rich feature engineering: smoothing, first and second derivatives, histogram statistics (mean, standard deviation, skew, kurtosis, Shannon entropy), and short (10-step) plus long (100-step) rolling-window aggregates, reduced to 200 principal components via PCA, with each window scored individually.
Trip-level scores were produced by taking the maximum anomaly score across a trip’s windows, on the assumption that a single highly anomalous moment should flag the entire trip.
Experiments & Model Selection
The submitted model was a six-detector ensemble (Isolation Forest, HBOS, INNE, ABOD, OCSVM, LOF) with averaged anomaly scores, reaching a validation AP of 0.5803 and AUC-ROC of 0.7653. PCA and t-SNE visualizations were used throughout to check whether each new feature improved class separability.
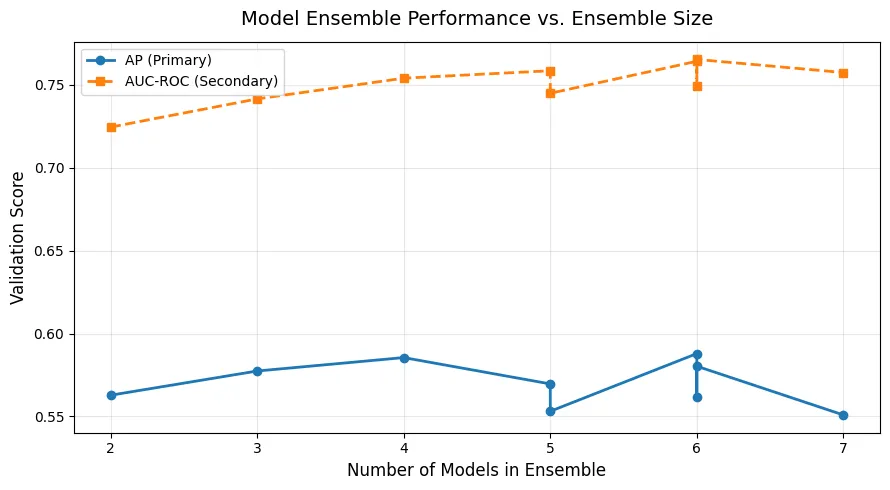
Validation AP (primary) and AUC-ROC (secondary) across ensemble sizes, with AP peaking at six models.
Results
Temporal feature engineering, not detector choice, drove the gains: features from the interpolated series alone lifted Isolation Forest AP about 70%, the single largest jump in the project. The final ensemble then cleared the All-Zeros (AP 0.2687) and Random-Guess (AP 0.2852) baselines by a wide margin, showing that a carefully composed set of classical detectors can surface rare engine failures from noisy, irregular sensor data without any deep learning.
Limitations & Lessons
- Window Independence: Scoring windows independently assumes local anomaly signatures, but longer-range degradation trends across multi-day trips may require sequential state modeling.
- Computational Cost of Density Detectors: Density-based detectors like LOF and KNN require high memory overhead for large datasets, reinforcing the need for feature selection and PCA prior to scoring.