
Overview
Hypertension is a leading risk factor for cardiovascular disease, so understanding what drives blood pressure is a useful step toward prevention. This project builds a multiple linear regression model to identify which demographic and lifestyle factors are associated with systolic blood pressure, and separately tests whether smoking has a measurable effect.
Research Questions
- Which factors are significantly associated with combined systolic blood pressure?
- Is there an association between smoking and blood pressure?
Data
The analysis uses the 2011-2012 US National Center for Health Statistics (NHANES) health and nutrition survey. Data from 400 participants over 17 years old across 16 variables were used for modelling, with a further 343 participants held out as test data. Predictors included gender, age, poverty ratio (family income relative to the poverty line), smoking status, BMI, race, education, and marital status.
Methodology
A multiple regression model with all 16 predictors was fit first to check variance inflation factors. Height, weight, and household income were dropped to remove multicollinearity, leaving a reduced model with 13 predictors. Three selection methods were then compared:
- Stepwise selection on AIC
- Stepwise selection on BIC
- LASSO shrinkage
Candidates were validated with cross-validation calibration plots and compared on adjusted R-squared, AIC, AICc, BIC, and prediction error. Model diagnostics covered linearity, homoscedasticity, normality (QQ plot), and influence (Cook’s distance, DFFITS, DFBETAS), with Box-Cox available for non-linearity.
Model Selection
| Method | Predictors | Prediction error | Adjusted R² | AIC | BIC |
|---|---|---|---|---|---|
| Stepwise AIC | Gender + Age + Poverty | 258.99 | 0.23 | 2208 | 2232 |
| Stepwise BIC | Gender + Age | 262.26 | 0.22 | 2209 | 2229 |
| LASSO | Age | 264.94 | 0.20 | 2216 | 2232 |
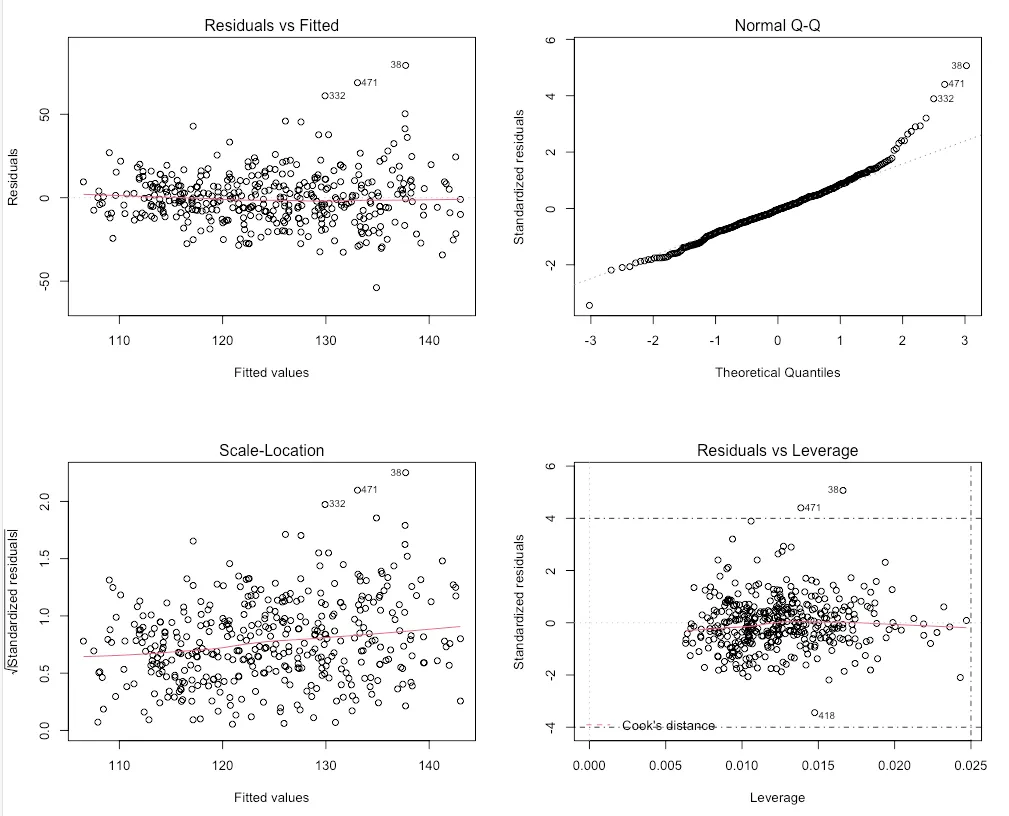
The stepwise AIC model was selected: it had the lowest prediction error, the highest adjusted R-squared, the smallest AIC, and the best fit to the ideal line in the calibration plots. Diagnostics showed the assumptions held, with no serious violations and only two outliers.
Final Model
| Term | Estimate | p-value |
|---|---|---|
| Male (vs Female) | +4.84 | 0.003 |
| Age (per year) | +0.50 | < 0.001 |
| Poverty ratio | -0.93 | 0.058 |
Age and gender were significantly associated with blood pressure: holding other factors constant, males averaged about 4.8 points higher than females, and blood pressure rose by about 0.5 points per year of age. The poverty ratio was only marginally significant, suggesting higher-income individuals tend toward slightly lower blood pressure. The model explains roughly 22% of the variance (adjusted R-squared 0.22), so it captures real signal while leaving much unexplained.
Smoking and Blood Pressure
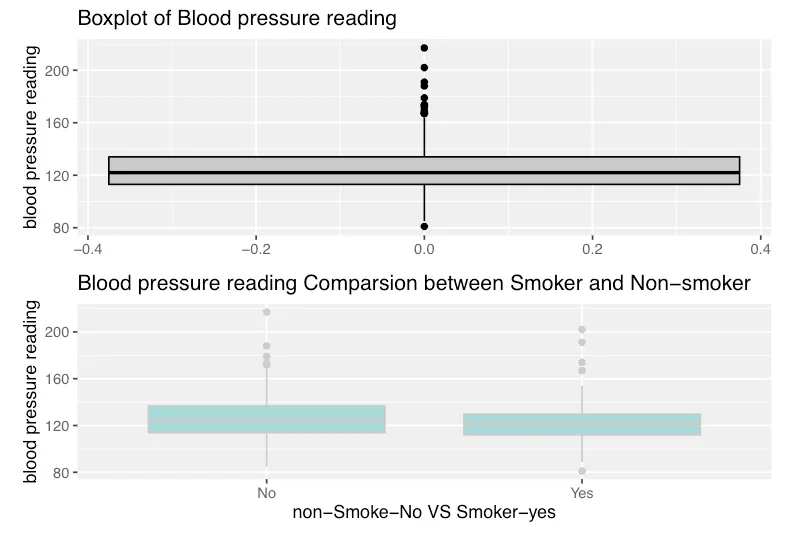
Adding smoking status to the final model produced a coefficient of just +0.08 with a p-value near 0.96, and the side-by-side boxplots for smokers and non-smokers both centred around 120. The data therefore show no significant association between smoking and blood pressure in this sample, a result worth revisiting with richer data.
Limitations
- Stepwise selection depends heavily on the data and can inflate test statistics, raising the chance of Type I error.
- Cook’s distance found no influential points, but DFFITS and DFBETAS flagged over ten, which may affect prediction accuracy.
- The overall prediction error remains large, so point predictions should be treated with caution.
Key Technologies
- Multiple linear regression: modelling systolic blood pressure
- Stepwise (AIC/BIC) and LASSO selection: choosing predictors
- Cross-validation and regression diagnostics: validating fit and assumptions
- R: data preparation, modelling, and visualization
References
- C.-Y. Wu et al. “High Blood Pressure and All-Cause and Cardiovascular Disease Mortalities in Community-Dwelling Older Adults.” Medicine, 2015.
- E. Oliveros et al. “Hypertension in older adults: Assessment, management, and challenges.” Clinical Cardiology, 2020.
- S. H. Bots, S. A. E. Peters, and M. Woodward. “Sex differences in coronary heart disease and stroke mortality.” BMJ Global Health, 2017.
- R. Lan et al. “Relationship between cigarette smoking and blood pressure in adults in Nepal.” PLOS Global Public Health, 2021.